12 Best Website Performance monitoring Tools for 2025
This article was assisted with AI. We may include links to partners.
A slow website is more than just an annoyance; it directly costs you money. Every second a visitor waits for your page to load, the chance they leave forever increases. This means lost sales, fewer sign-ups, and a damaged brand reputation. For small businesses and freelancers, where every visitor is valuable, this is a critical problem. Poor performance also harms your search engine rankings, making it harder for new customers to find you. The issue is simple: if your site is slow, visitors will go to a competitor.
This guide helps you fix that problem. We will break down the best website performance monitoring tools, so you can find and solve speed issues effectively. Instead of just listing features, we provide practical analysis of each tool, focusing on real-world use for small businesses and entrepreneurs. You'll learn about "synthetic monitoring," which acts like a robot visitor to check if your site is online, and "Real User Monitoring (RUM)," which tracks the experience of actual visitors to see what's slow for them.
Each review includes screenshots, direct links, and a clear breakdown of pros, cons, and pricing to help you decide without needing a technical background. Our goal is to give you the right information to choose the best platform, ensuring your website is fast, reliable, and ready to turn visitors into loyal customers.
1. Datadog
Datadog is more than a simple uptime checker; it's a comprehensive monitoring platform for teams who need to see how website performance connects to their entire system. It combines "Synthetic Monitoring" (proactive tests) and "Real User Monitoring" (RUM) to show you both how your site should perform and how it actually performs for real people.
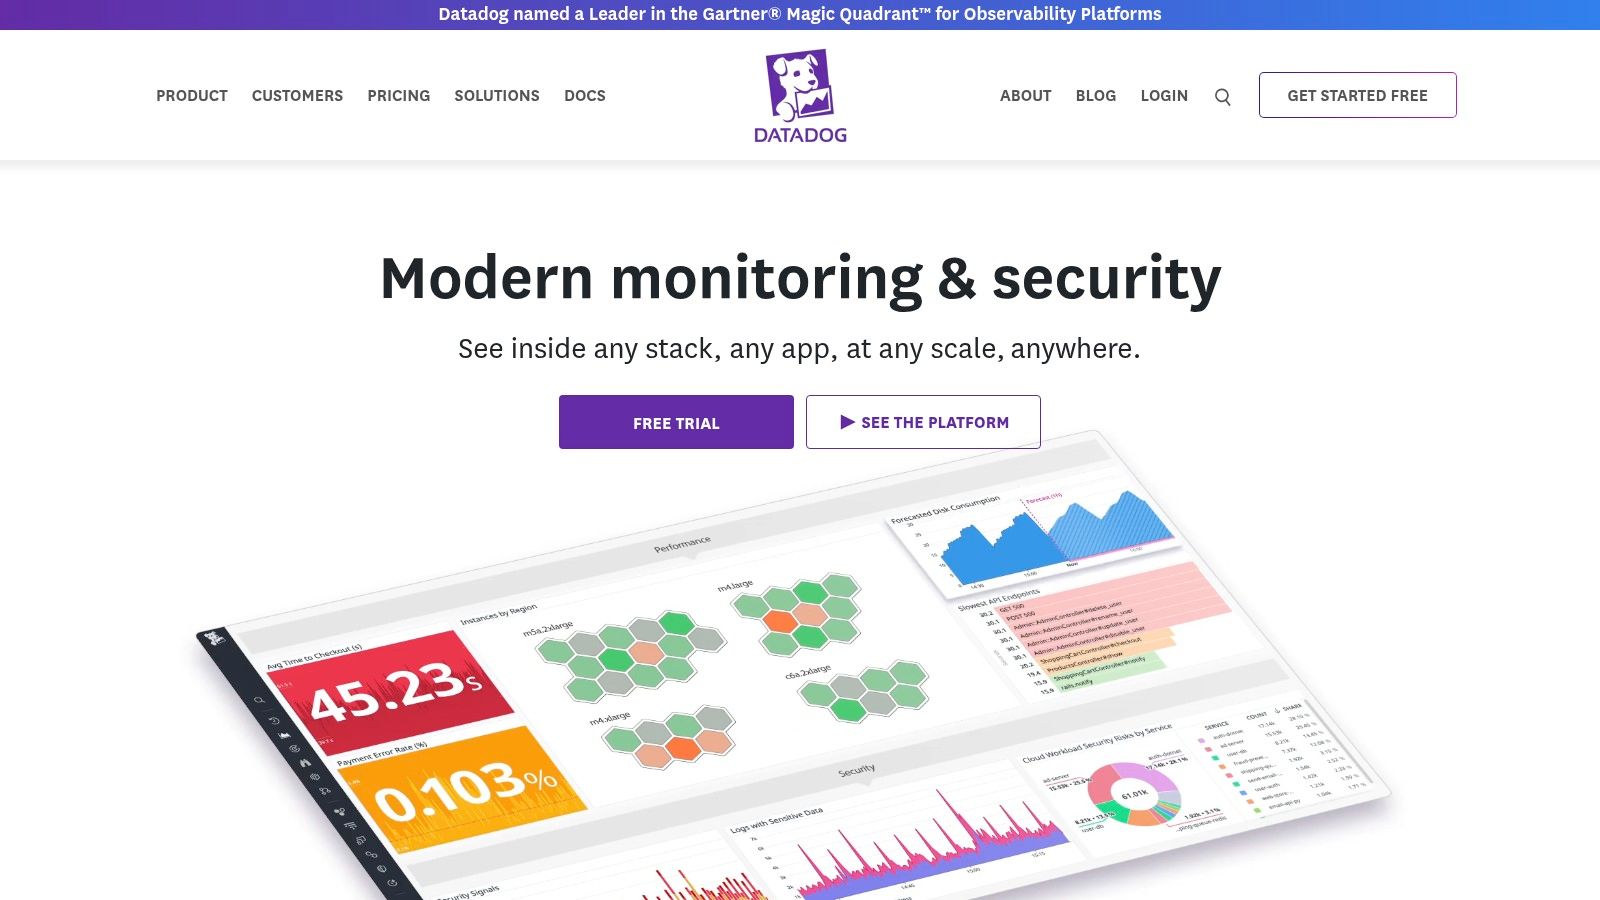
The platform connects website data with backend application performance (APM), server logs, and infrastructure metrics. For a small business, this means your developer can trace a slow-loading webpage directly back to a struggling database or a server problem, all in one place. While it has many features and can take time to learn, it’s powerful for growing businesses.
Key Features & Considerations
- Synthetic Tests: Use a no-code recorder to simulate user actions, like adding an item to a cart, from different parts of the world.
- Real User Monitoring (RUM): See how real visitors experience your site, finding code errors and slow-loading images that affect specific regions or devices.
- Pricing Model: Pay-as-you-go is flexible but requires watching your usage. You pay for a certain number of API or browser test runs.
- Best For: Technically skilled small businesses, freelancers managing complex client sites, and teams wanting one tool for all their monitoring.
Actionable Tip: Start with Datadog's free tier to monitor key user actions with Synthetic browser tests. This helps you understand your site's normal performance before you pay for a plan. Using this data is a great first step, and you can get even more insights from this guide to website optimization.
Website: https://www.datadoghq.com
2. New Relic
New Relic is a powerful all-in-one monitoring platform that stands out with one of the most generous free tiers, making it an excellent starting point for businesses wanting professional-grade website performance monitoring tools without paying upfront. Like other advanced platforms, it combines "Synthetic Monitoring" (proactive checks) and "Browser Monitoring" (Real User Monitoring) to give you a complete view of your site's performance.
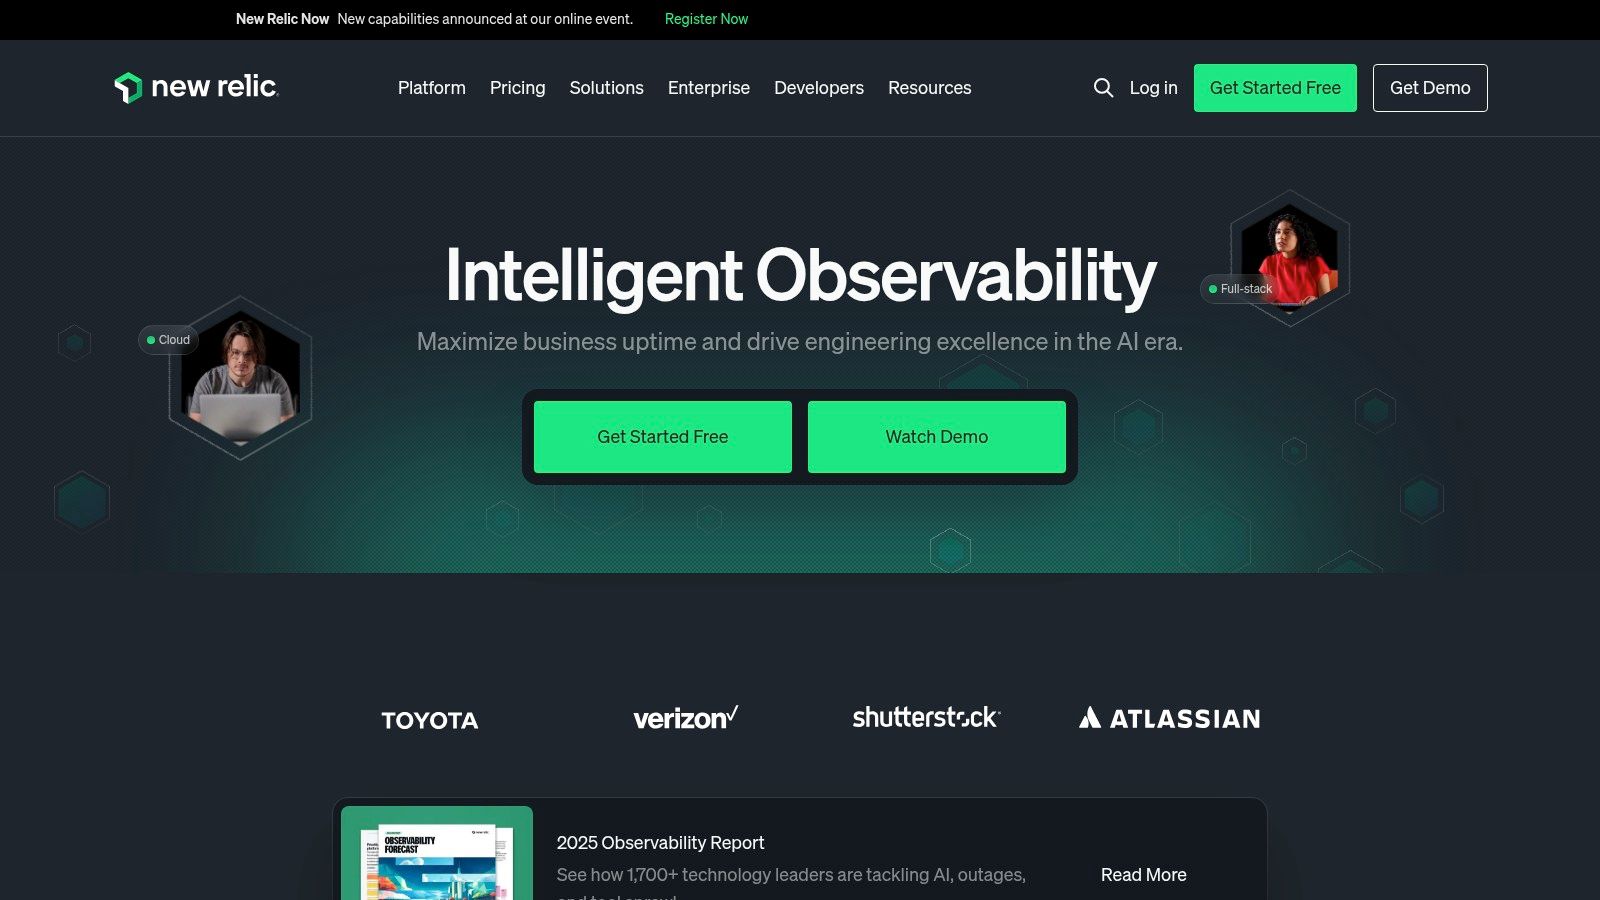
The platform links website health with backend application performance, infrastructure data, and logs. This means you can track a slow-loading page found by the Browser agent directly to its root cause, whether it's a code error or a server-side problem. Its comprehensive features and helpful guides make it a strong choice for teams looking to use one monitoring tool as they grow.
Key Features & Considerations
- Generous Free Tier: Includes 100 GB of data per month, one full user, and access to the entire platform, including Synthetics and Browser monitoring.
- Browser (RUM) Monitoring: Tracks real user experiences, including Google's Core Web Vitals, page load times, and code errors, giving you insight into actual visitor journeys.
- Pricing Model: Usage-based pricing beyond the free tier can become expensive if you don't monitor your data usage and user seats.
- Best For: Small businesses and freelancers wanting a full-featured tool with a free entry point, and teams that want to monitor their entire system in one place.
Actionable Tip: Set up Browser monitoring on your most important pages first using the free tier. This will immediately start collecting Core Web Vitals and error data from real users, giving you a baseline to measure improvements against at no cost.
Website: https://newrelic.com
3. Dynatrace
Dynatrace is an advanced monitoring platform that uses a powerful AI engine, named Davis, to automatically find the root cause of problems. It offers a full set of website performance monitoring tools, including Real User Monitoring (RUM) and synthetic tests, but its real strength is connecting user-facing performance issues directly to underlying problems in your infrastructure or code. This makes it a great choice for teams needing deep, automated insights.
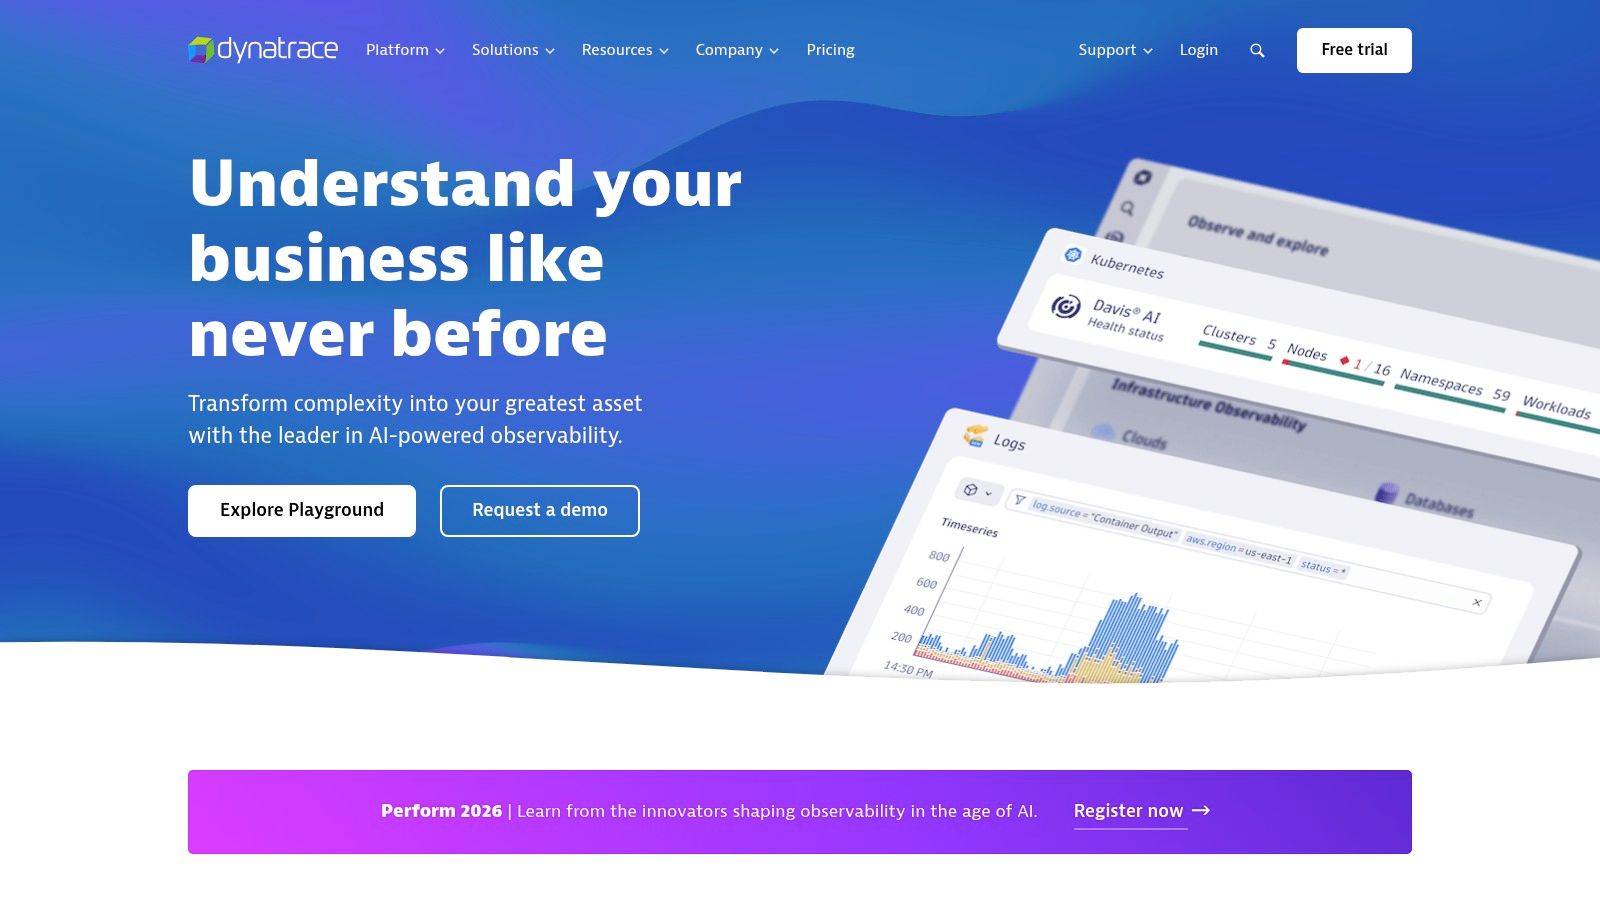
While its advanced features are often used by large companies, Dynatrace provides clear pricing that can work for smaller businesses too. For a freelancer managing a critical website, the platform can automatically identify that a slow checkout process is caused by a specific database problem, saving hours of manual work. The platform's ability to provide precise answers, not just data, is what makes it different.
Key Features & Considerations
- AI-Powered Diagnostics: The Davis AI engine automatically analyzes performance data to pinpoint the exact root cause of issues, removing guesswork.
- Full-Stack Observability: Connects RUM and synthetic data with backend services, logs, and server metrics.
- Pricing Model: Offers a transparent rate card. RUM is priced per user session, and synthetic requests are priced individually, which can be hard to estimate upfront.
- Best For: Businesses with mission-critical websites, technical freelancers, and organizations that need automated, in-depth problem diagnosis.
Actionable Tip: Use Dynatrace's browser clickpath recorder to simulate a critical user action, like submitting your contact form or completing a purchase. Let the AI engine analyze the results to automatically find performance bottlenecks you might have otherwise missed.
Website: https://www.dynatrace.com
4. Pingdom (SolarWinds)
Pingdom has long been a go-to choice for teams wanting straightforward, reliable website performance monitoring tools without the complexity of a massive monitoring platform. It specializes in uptime, page speed, and transaction monitoring, making it very easy to use for marketers, small business owners, and web managers. Its strength is presenting critical performance data in an easy-to-understand format.
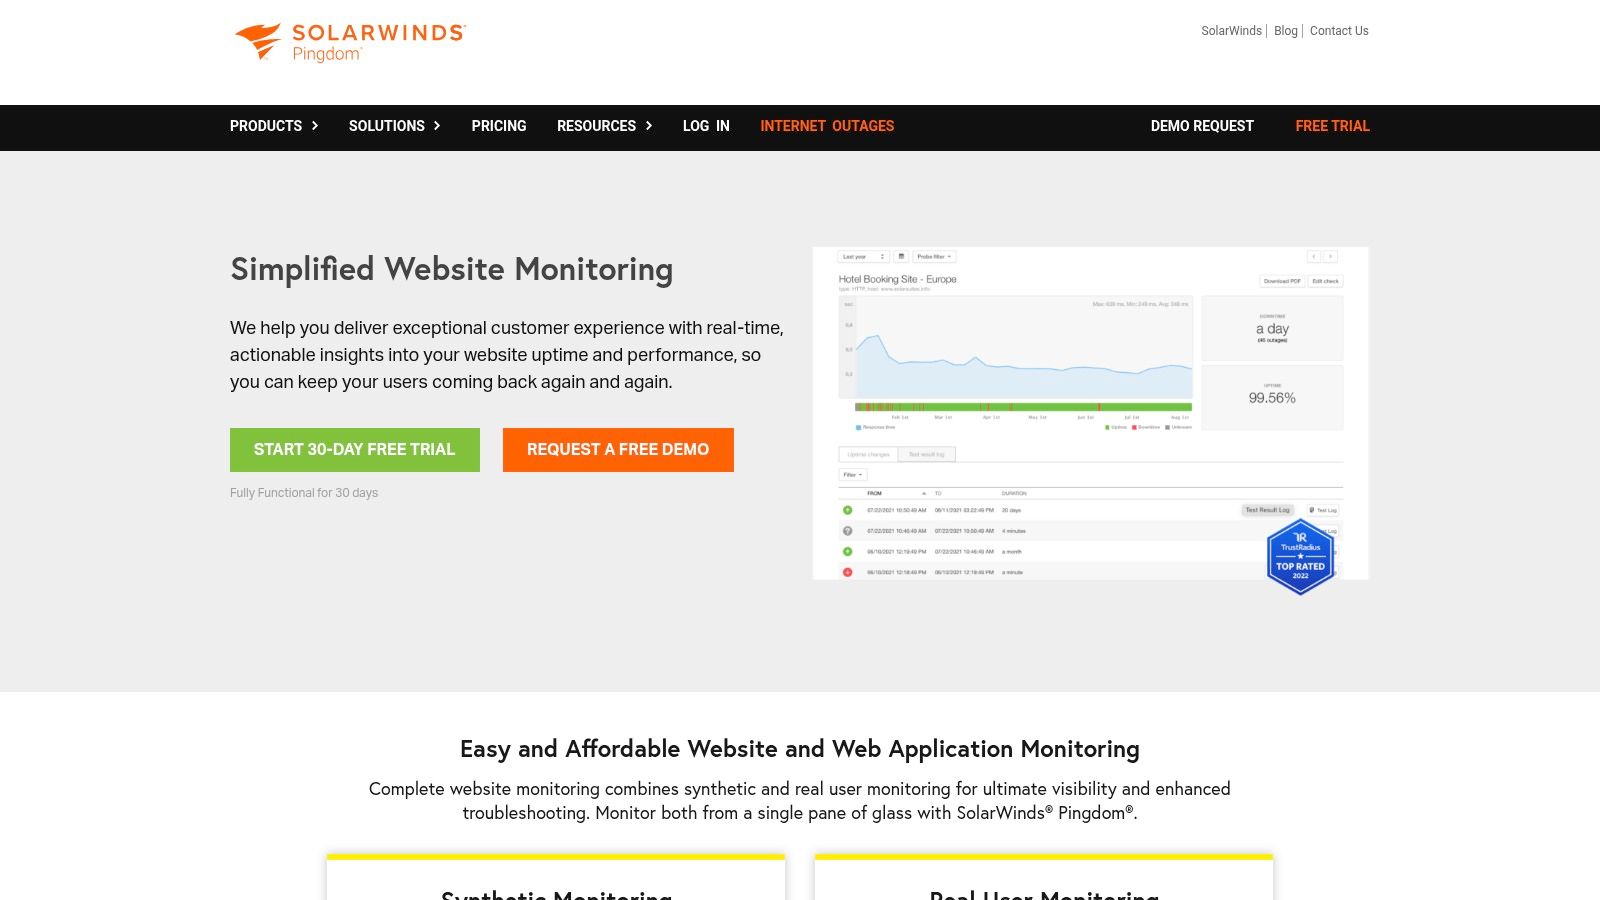
The platform is designed to be used right away. You can set up global uptime checks and page speed tests in minutes, getting alerts the moment your site goes down or a key page starts to slow down. For e-commerce sites, the transaction monitoring recorder lets you simulate a user's path, such as searching for a product and adding it to the cart, to make sure important processes are always working. While it doesn't offer deep server insights, its focus on the end-user experience is perfect for non-technical teams.
Key Features & Considerations
- Global Uptime Checks: Monitor your website's availability from over 100 locations worldwide to catch regional outages.
- Page Speed Analysis: Get a detailed breakdown of your site’s load performance, identifying which elements (images, scripts) are causing slowdowns.
- Transaction Monitoring: Easily record and automate tests for critical user actions like sign-ups or checkouts without writing code.
- Pricing Model: Offers a 30-day free trial. Paid plans are typically based on the number of checks you run.
- Best For: Small businesses, e-commerce stores, and marketers who need clear, actionable data on website availability and user experience without technical jargon.
Actionable Tip: Use the transaction recorder to monitor your most important conversion process (e.g., the checkout flow). This ensures you're immediately alerted if any step breaks, protecting your revenue and user trust. Ensuring your site is available is as important as its security, a topic you can explore further with these website security best practices.
Website: https://www.pingdom.com
5. Uptrends
Uptrends offers a very user-friendly set of website performance monitoring tools, making it an excellent choice for businesses that need powerful insights without a steep learning curve. It shines with its huge global network of over 230 monitoring locations, allowing you to test your site's speed and availability from the same places as your customers. The platform combines "Synthetic Monitoring" for proactive checks with "Real User Monitoring" (RUM) to see how actual visitors experience your site.
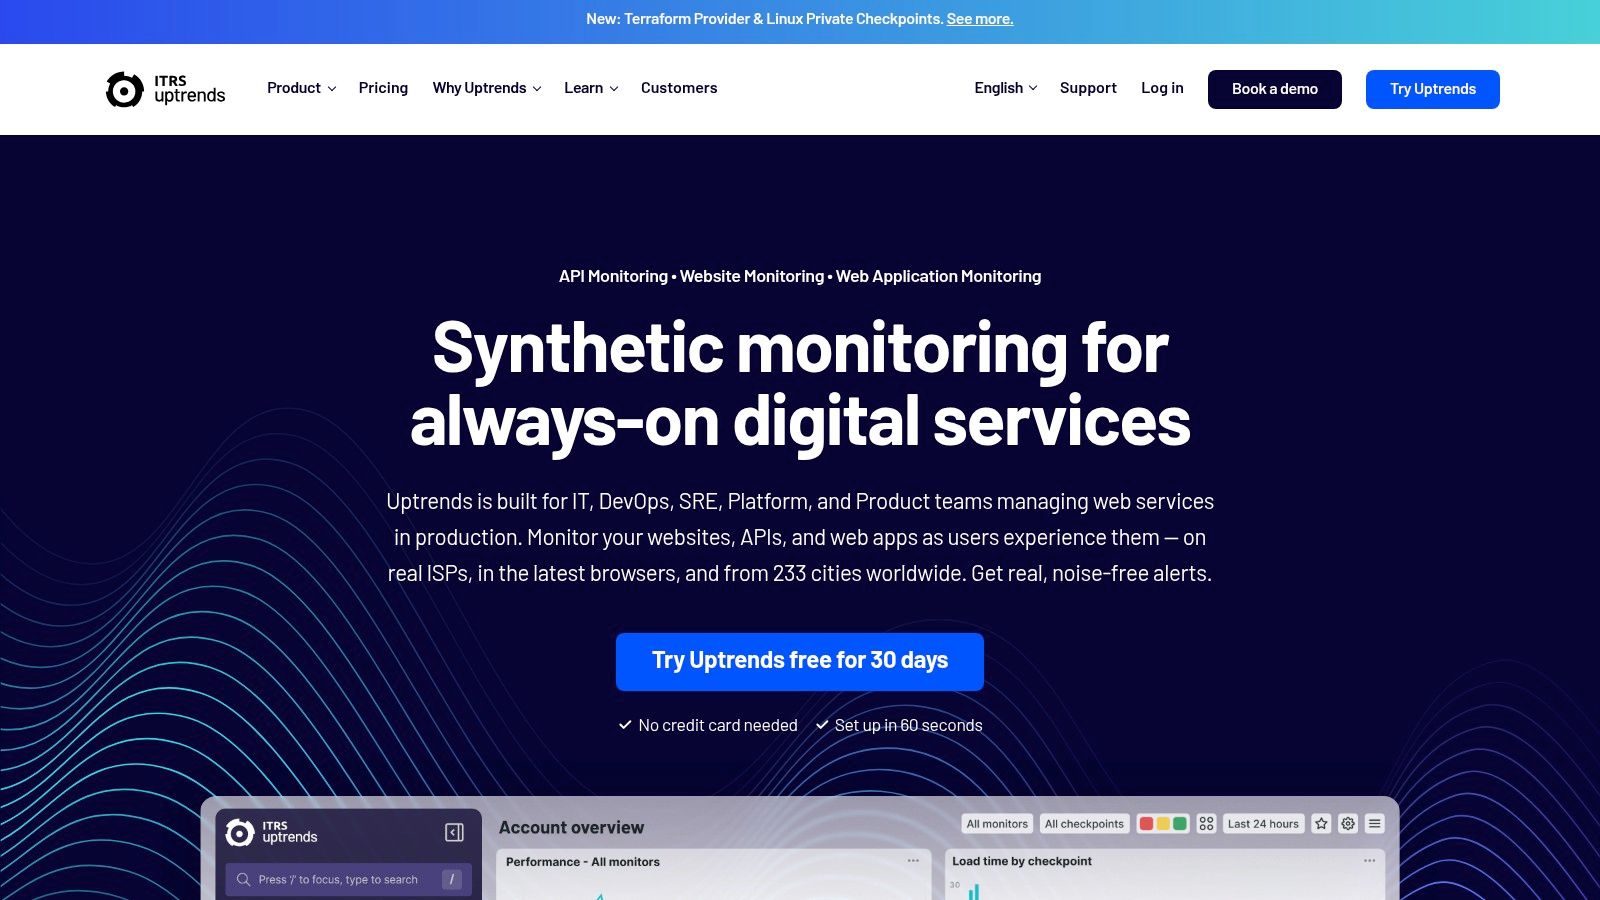
What sets Uptrends apart is its user-friendly transaction recorder, which lets you create multi-step user journey tests (like a checkout process) without writing any code. This makes it incredibly easy for non-technical users to set up advanced monitoring. While its analytics may not be as deep as enterprise-level tools, its balance of features and ease of use is ideal for small businesses and freelancers wanting robust, actionable data quickly.
Key Features & Considerations
- Global Checkpoints: Test your website from over 230 locations to get a true picture of global performance.
- Transaction Recorder: A simple point-and-click tool to record and monitor critical user paths like logins and form submissions.
- Real User Monitoring (RUM): Analyze performance data from real visitors, sorted by browser, device, and country.
- Pricing Model: Uses a flexible but sometimes confusing credit-based system. You buy credits to spend on different types of monitors.
- Best For: Small businesses and agencies needing an easy-to-use tool for both uptime and multi-step transaction monitoring.
Actionable Tip: Use the free Uptrends Website Speed Test tool to get a quick performance baseline from multiple global locations. This can help you identify which specific monitoring locations you should focus on when setting up your account to use your budget effectively.
Website: https://www.uptrends.com
6. UptimeRobot
UptimeRobot is one of the most popular and simple website performance monitoring tools, focusing on one core mission: telling you if your website is down. It’s a very accessible starting point for freelancers and small businesses who need reliable availability checks without the complexity or cost of a full monitoring platform. It excels at its main job, providing simple, no-fuss uptime monitoring from multiple global locations.
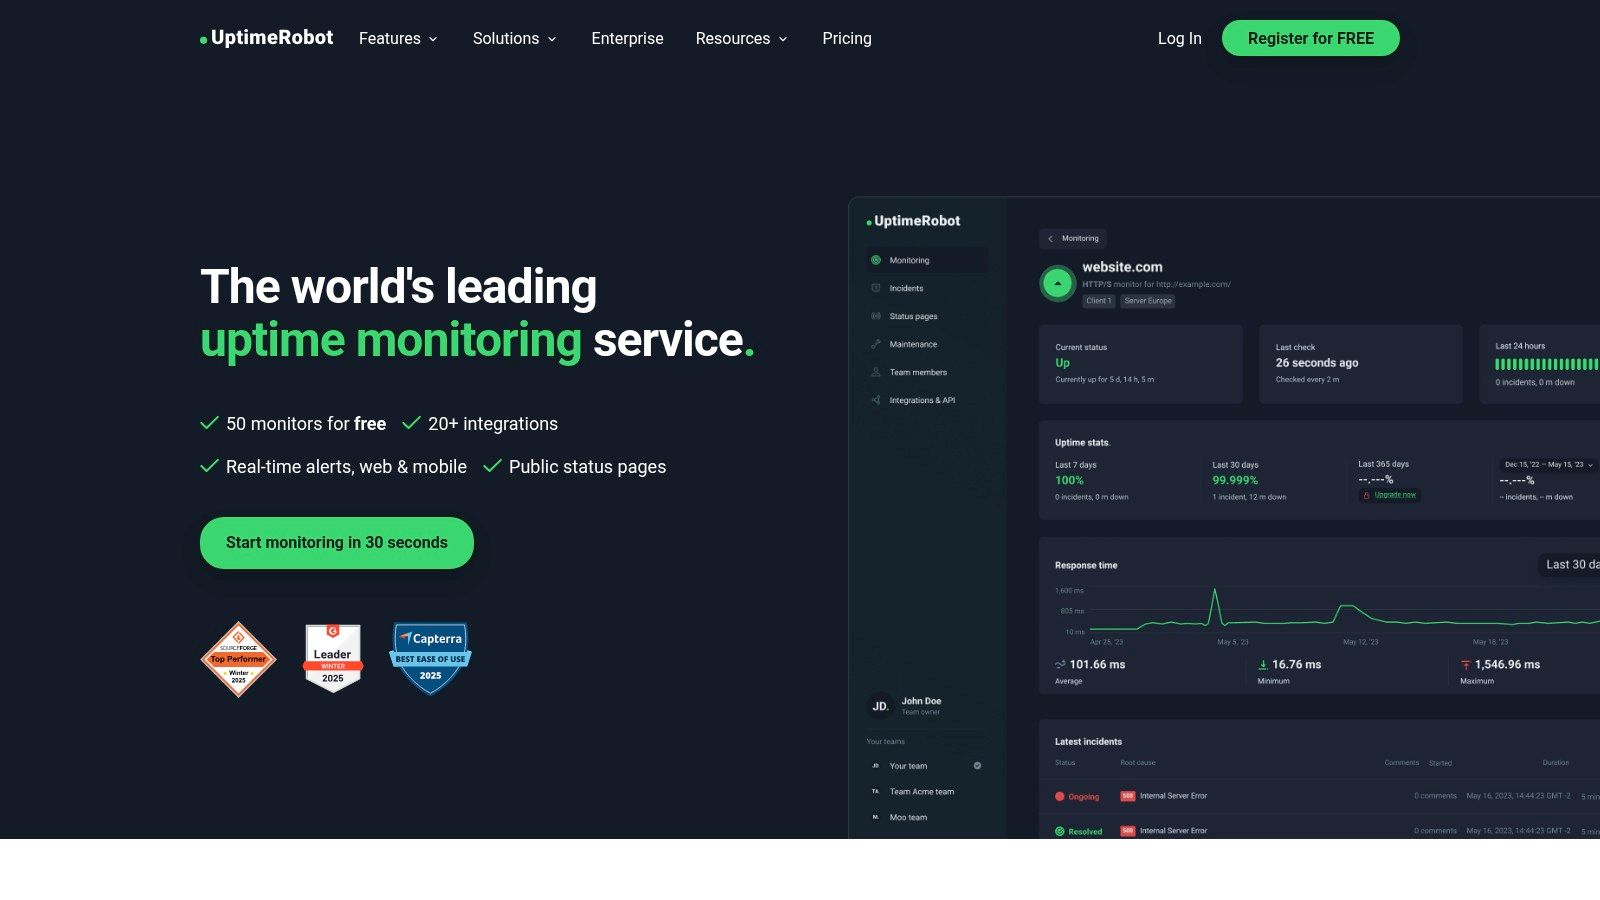
What sets UptimeRobot apart is its simplicity and generous free tier. You can set up essential website checks, keyword monitoring (to ensure specific text is present on a page), and other technical checks in minutes. While it doesn't offer the deep performance analysis of Real User Monitoring (RUM) or complex synthetic tests, its value is in being a dependable, low-cost "first alert" system. When you just need to know the moment your site goes offline, it’s hard to beat.
Key Features & Considerations
- Fast Check Intervals: Paid plans offer monitoring as often as every 30 seconds, ensuring you know about downtime almost immediately.
- Status Pages: Create public or private status pages to keep your customers or internal teams informed during an outage, building trust.
- Pricing Model: Offers a powerful free plan with 50 monitors at 5-minute intervals. Paid plans are very affordable.
- Best For: Freelancers, bloggers, and small businesses needing a simple, budget-friendly, and reliable tool primarily for uptime monitoring.
Actionable Tip: Use UptimeRobot’s keyword monitoring feature on your most critical pages. Set it to check for a unique phrase in your footer, like your company name. This not only confirms your site is up but also that it’s loading content correctly, catching errors that a simple uptime check might miss.
Website: https://uptimerobot.com
7. GTmetrix
GTmetrix is a highly focused performance tool that excels at providing deep, page-level analysis. Instead of offering a full monitoring suite, it specializes in scheduled, lab-based testing using Google Lighthouse data. This makes it an ideal choice for freelancers and small businesses who need to track and improve Core Web Vitals and other performance metrics on key pages over time.
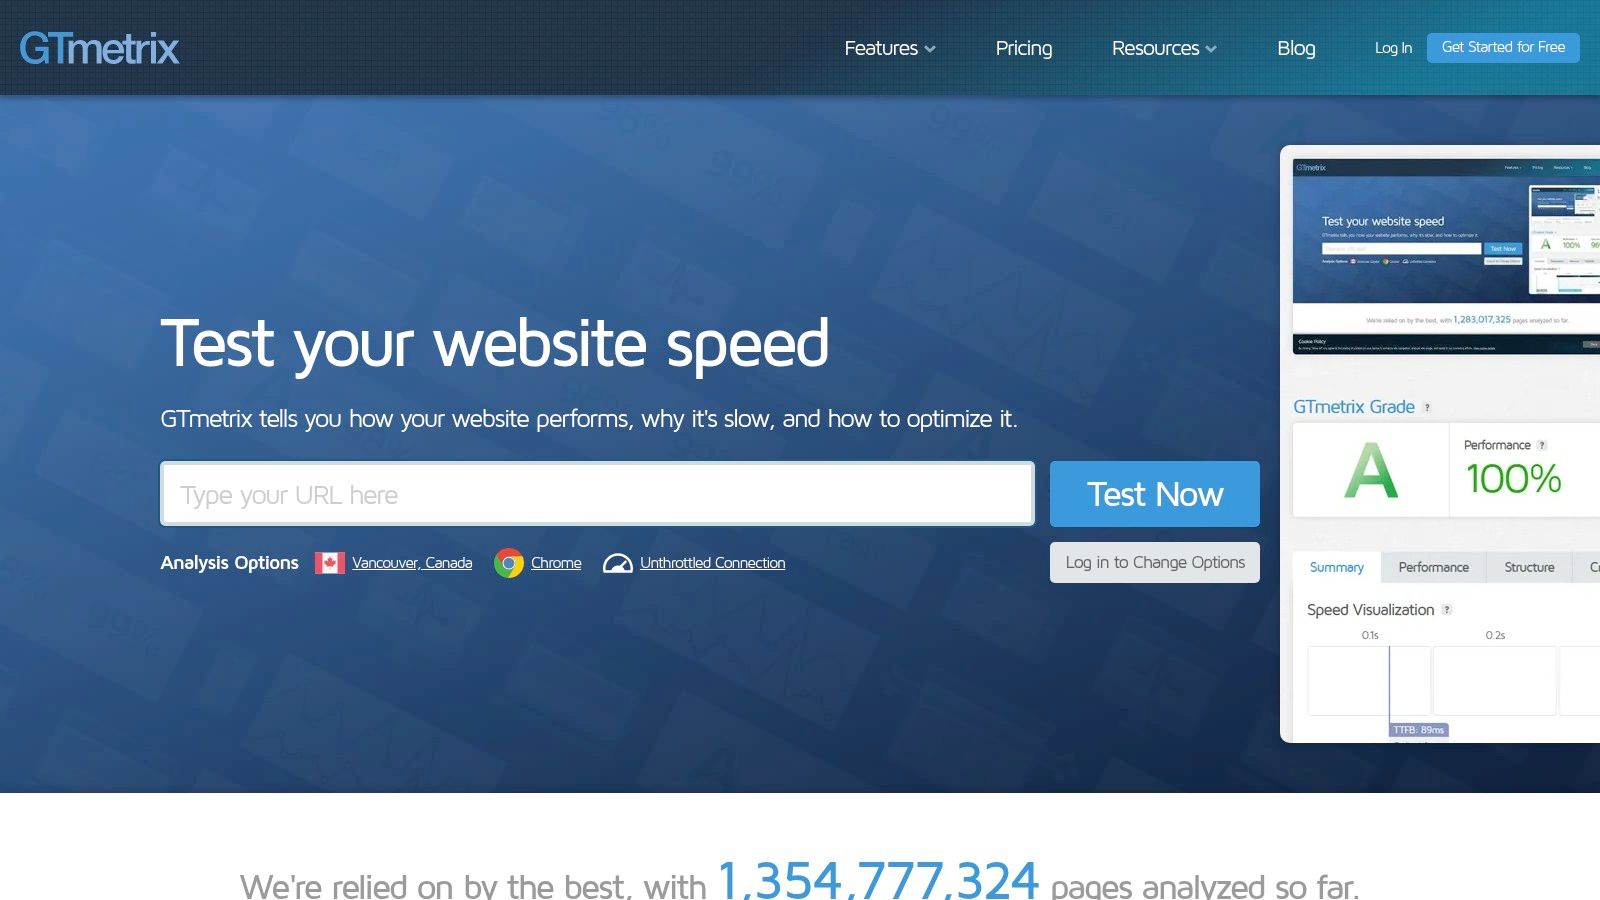
The platform’s strength is in its visual reports. Features like detailed "waterfall" charts, filmstrips, and video playback of page loads allow you to see exactly which elements are slowing your site down. It provides clear, actionable recommendations for improvement, explaining technical terms simply. While it doesn't measure real user experiences, it's one of the best website performance monitoring tools for repeatable, controlled testing.
Key Features & Considerations
- Scheduled Monitoring: Automate performance tests on your most important URLs daily, weekly, or monthly, with alerts for when performance drops.
- Visual Diagnostics: Use filmstrips and video capture to see exactly how your page loads for visitors, making it easy to spot visual problems.
- Global Test Locations: Test your site's speed from over 20 global locations with various device and connection speed settings.
- Best For: Small businesses and freelancers focused on optimizing specific landing pages, tracking Core Web Vitals, and generating straightforward performance reports.
Actionable Tip: Set up a daily scheduled monitor for your homepage and a key service or product page. Use the alert system to get notified if your Performance Score drops below a certain number, allowing you to react quickly to issues before they impact users. These insights are crucial for maintaining a professional website, which you can learn more about creating here.
Website: https://gtmetrix.com
8. SpeedCurve
SpeedCurve is a specialized tool that connects website performance, user experience (UX), and business goals. It uniquely blends "Synthetic Monitoring" with "Real User Monitoring" (RUM) to show you not just how fast your site is, but how that speed impacts metrics like bounce rates and conversions. This makes it an excellent choice for teams that need to justify performance work with real business results.
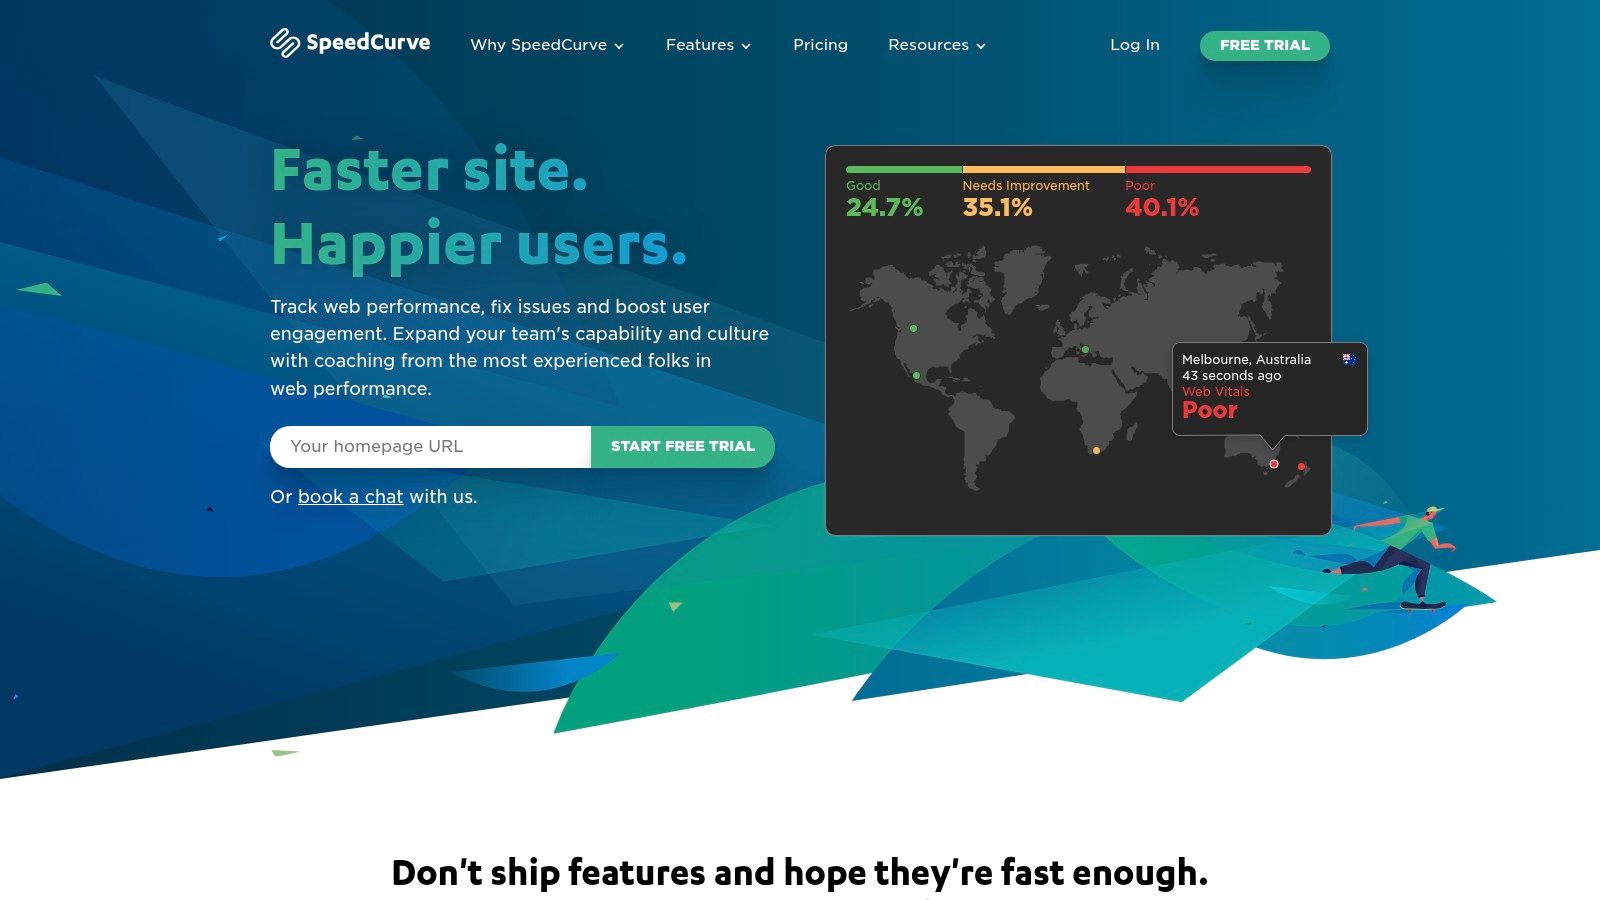
The platform stands out with its visual-first dashboards, including filmstrips that show how your pages render over time and how they compare against competitors. For an e-commerce business, this means you can see precisely when a product image or "Add to Cart" button appears for users, helping you optimize what loads first. While more expensive than basic uptime checkers, its focus on connecting speed with business results provides a clear return on investment.
Key Features & Considerations
- Business Impact Focus: Create custom dashboards that track Core Web Vitals alongside conversion rates, bounce rates, and other key business metrics.
- Synthetic & RUM: Get detailed lab data from Lighthouse audits and synthetic tests, then confirm it with real-world performance data from actual visitors.
- Pricing Model: Plans are customizable and start at $90/month, scaling based on the number of RUM page views and synthetic checks needed.
- Best For: E-commerce sites, media companies, and freelancers who need to show clients the financial impact of site speed improvements.
Actionable Tip: Use SpeedCurve's 30-day free trial to set up a "performance budget." For example, you can set a rule that your homepage must load its main content in under 2.5 seconds. The tool will then alert you if a new code update violates this budget, letting you catch problems before they affect users.
Website: https://www.speedcurve.com
9. WebPageTest
WebPageTest is the industry-standard tool for deep-dive lab testing, offering unmatched control over test conditions. While many tools provide a simplified speed score, WebPageTest gives you a granular, frame-by-frame breakdown of how your site loads on real devices from global locations. It's the go-to resource for performance experts and developers who need to diagnose complex loading issues with high precision.
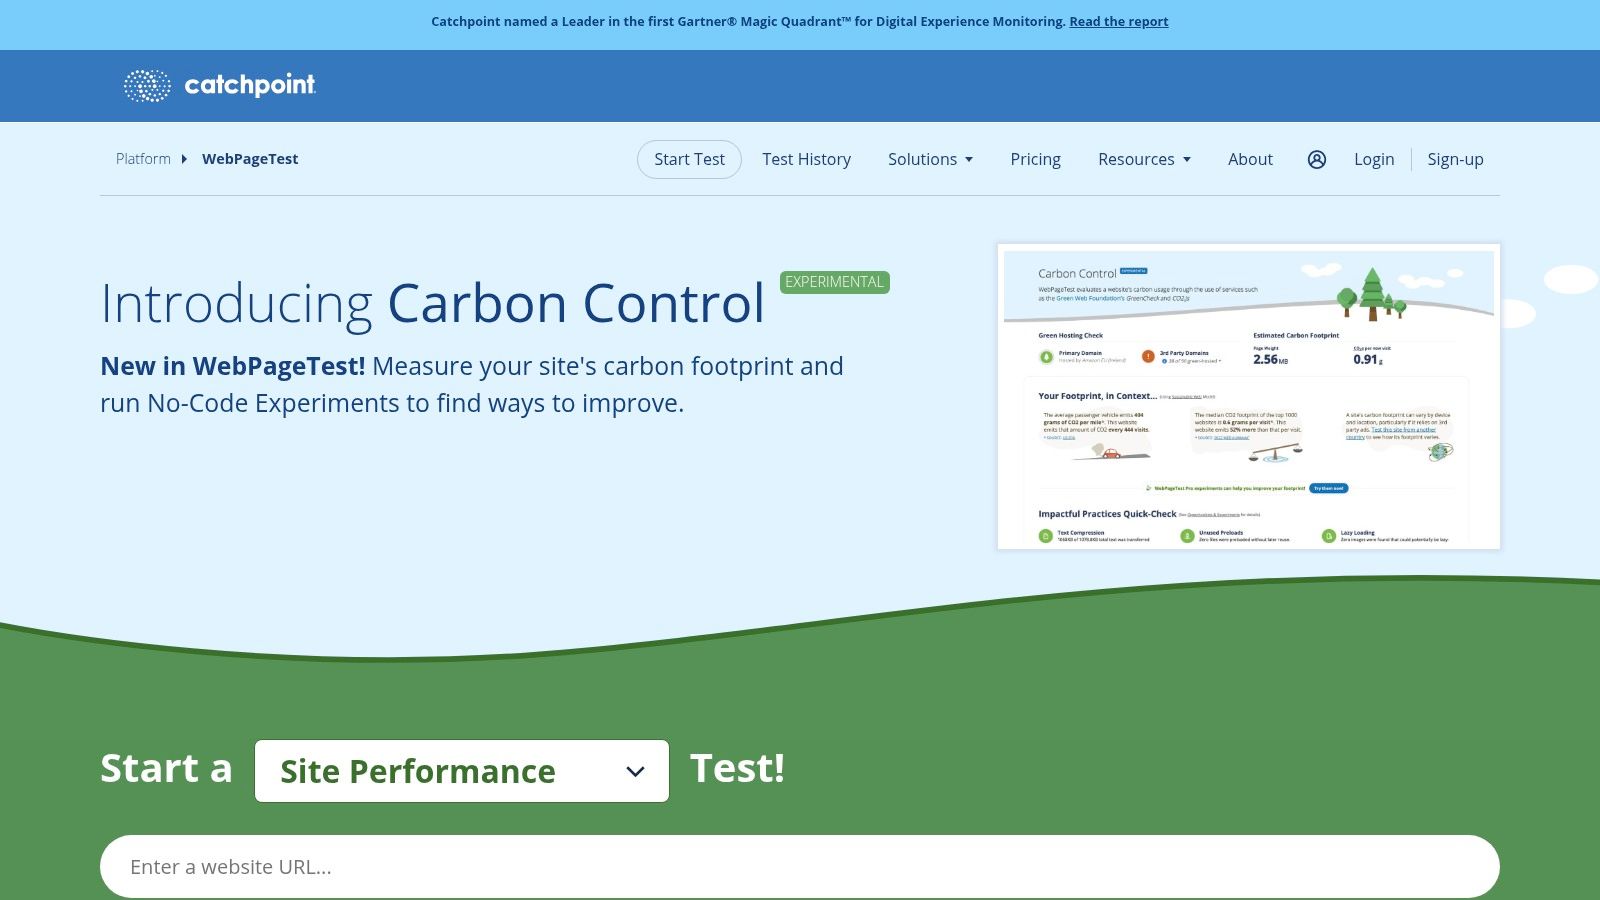
This platform excels at providing detailed diagnostic data, like waterfall charts, video captures, and filmstrip views, that visually show exactly when and how elements appear on the screen. For a freelancer, this means you can pinpoint a specific image that's blocking the page load or identify an inefficient script for a client. While it focuses on controlled lab tests rather than continuous real user monitoring, its depth of analysis is unmatched for one-off performance checks and debugging.
Key Features & Considerations
- Granular Lab Testing: Test from dozens of locations on real browsers with precise control over connection speeds and device types.
- Detailed Diagnostics: Generates comprehensive waterfall charts, filmstrips, and video captures to visualize the loading sequence.
- API and Automation: Pro plans offer robust API access, allowing you to integrate performance testing directly into your development workflow.
- Best For: Freelancers and developers needing to conduct in-depth performance audits, diagnose specific loading problems, and confirm optimization efforts.
Actionable Tip: Use the "Test Comparison" feature to run a test on your site and a competitor's side-by-side. This provides a clear, visual report showing exactly where your site's performance differs, highlighting specific optimization opportunities you can tackle first.
Website: https://www.webpagetest.org
10. Amazon CloudWatch (Synthetics + RUM)
For businesses already using Amazon Web Services (AWS), Amazon CloudWatch offers a powerful and native solution for website performance monitoring. It combines CloudWatch Synthetics, which runs "canaries" (scripted tests) to proactively check your site, with Real User Monitoring (RUM) to collect performance data from actual visitors. This native integration is its key advantage, allowing teams to seamlessly connect website issues to their underlying AWS infrastructure.
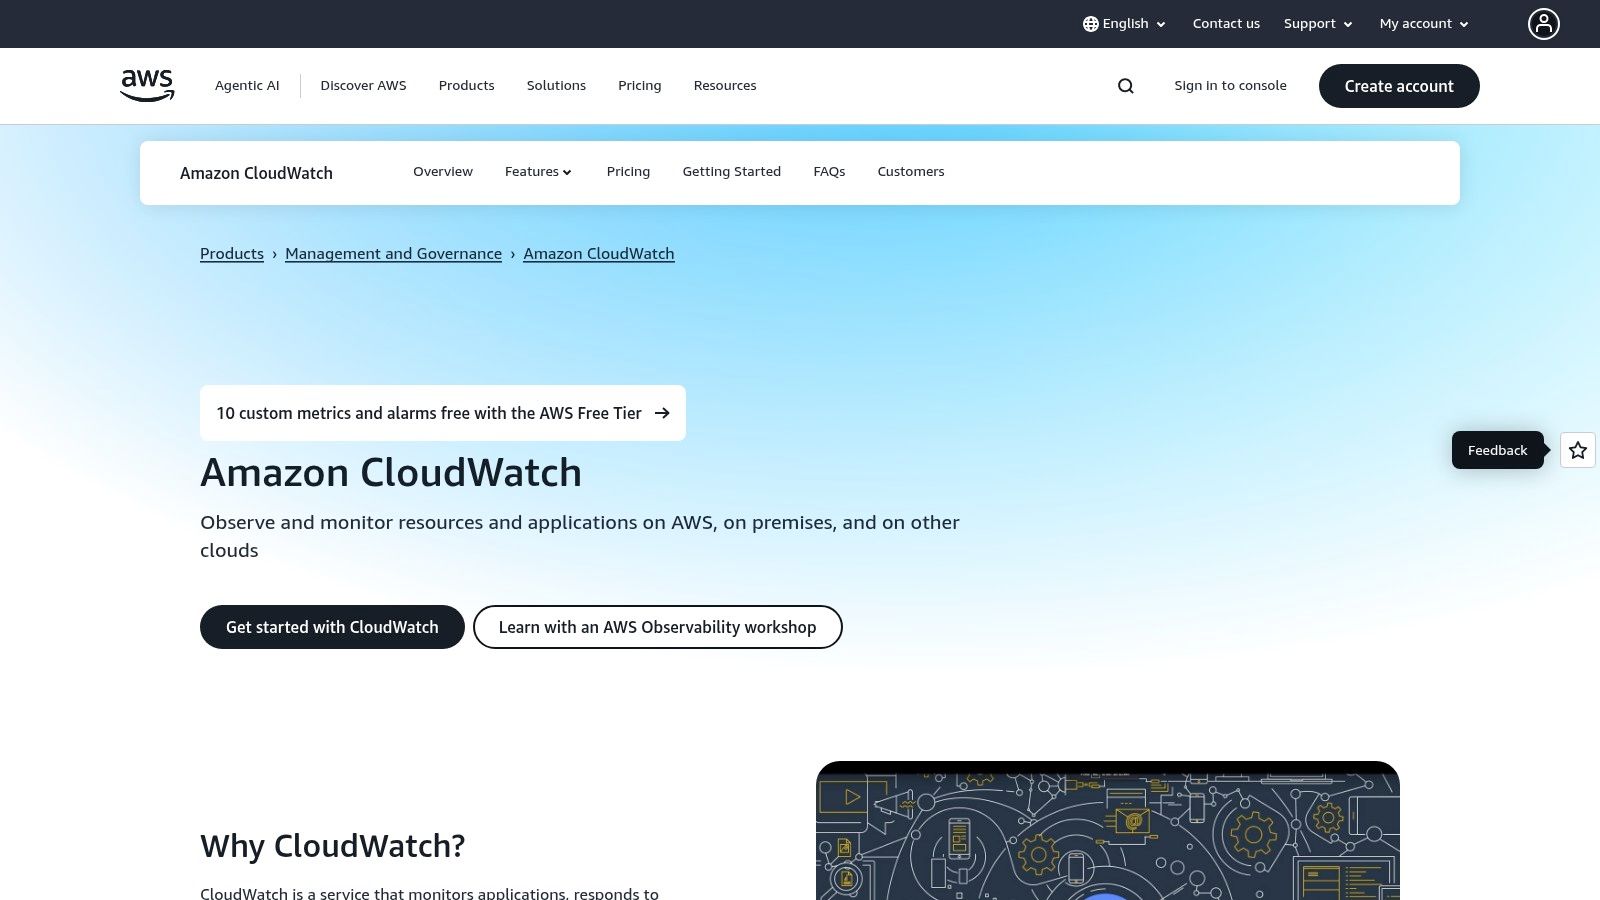
The platform is less a standalone tool and more an extension of your existing cloud setup. If your site is hosted on AWS, you can easily trace a slow-loading page identified by RUM directly to a specific server function or database query using other CloudWatch services. While this provides great depth for AWS users, it can be complex for those unfamiliar with the system, and costs can be tricky to predict as they are spread across multiple services.
Key Features & Considerations
- Synthetic Canaries: Create scripts to monitor your site or simulate user journeys. They can even run within your private network to test internal applications.
- Real User Monitoring (RUM): Tracks core web vitals and client-side errors, with pricing based on the number of events collected.
- Pricing Model: Purely usage-based. The free tier includes 100 canary runs per month, but be mindful of associated costs for logs and data storage.
- Best For: Freelancers and small businesses heavily invested in the AWS infrastructure who want deeply integrated monitoring without adding another third-party tool.
Actionable Tip: If you're on AWS, use the free tier's 100 canary runs to set up a simple "heartbeat" check on your website's homepage and login page. This gives you a baseline uptime and speed metric without any initial cost.
Website: https://aws.amazon.com/cloudwatch
11. Microsoft Azure Monitor (Application Insights + Web tests)
For businesses already invested in the Microsoft Azure ecosystem, Azure Monitor is the native solution for website performance monitoring. It combines Application Insights for Real User Monitoring (RUM) with availability tests for synthetic checks, offering a deeply integrated monitoring experience. Its primary strength is connecting frontend performance directly to backend Azure services.
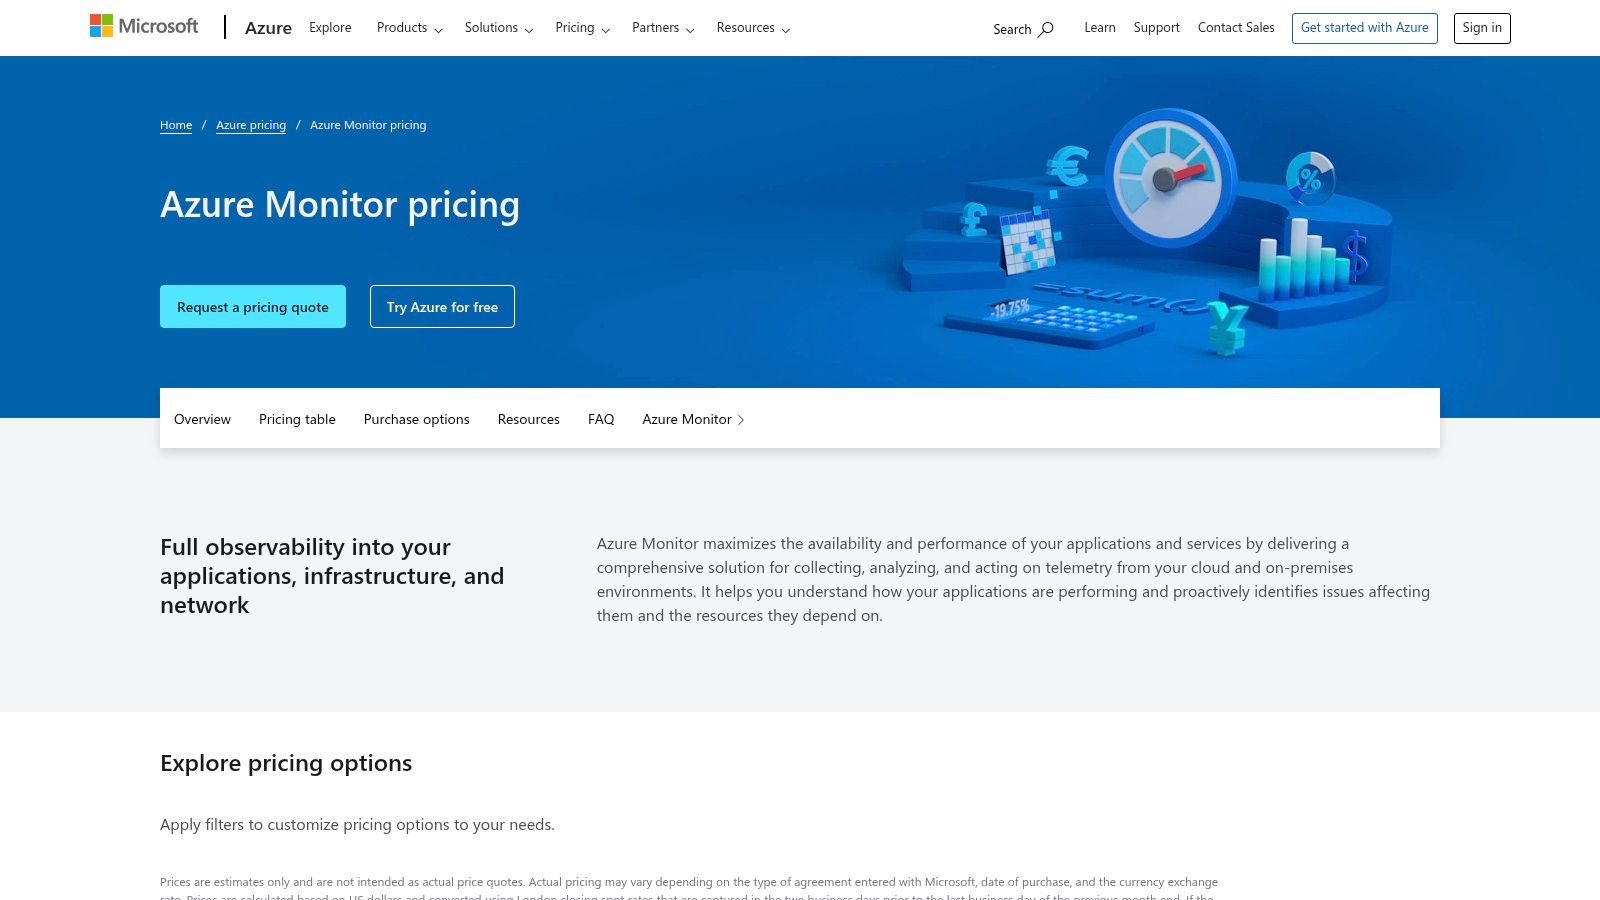
This tool stands out with its powerful query language (KQL), which allows for incredibly detailed and custom analysis of your performance data. You can go beyond pre-built dashboards to ask specific questions, such as connecting a spike in code errors with a recent website update. While its pricing is based on data usage and can be complex, the tight integration for Azure users provides diagnostic capabilities that are hard to match with third-party tools.
Key Features & Considerations
- Native Azure Integration: Seamlessly connects website performance data with other Azure services like App Service, Functions, and databases.
- Powerful Analytics with KQL: Go beyond standard reports by writing custom queries to diagnose complex performance issues and user behavior.
- Pricing Model: Primarily usage-based, centered on the volume of data used per GB.
- Best For: Businesses and freelancers who host their applications and websites on Microsoft Azure and require deep, query-based diagnostic capabilities.
Actionable Tip: Start with the free data allowance to monitor your site’s Core Web Vitals and key page load times using Application Insights. Use the pre-built "Failures" report to quickly find and fix the most common code errors affecting your users.
Website: https://azure.microsoft.com/pricing/details/monitor/
12. G2 – Website Monitoring Software category
Instead of being a direct monitoring tool, G2's Website Monitoring category is a powerful research hub. It acts as a dynamic marketplace where you can compare dozens of website performance monitoring tools based on real, verified user reviews. This is invaluable for small businesses that don't have time to try out every platform. It gathers user ratings, pros and cons, and detailed feature lists into one accessible place.
The platform stands out by allowing you to filter options by business size, specific features (like RUM or synthetic testing), and user satisfaction scores. This helps you quickly narrow down a shortlist of vendors that fit your budget and technical needs. The process of comparing and selecting the right platforms is critical across all business functions. For a broader look at data-driven insights, you might also be interested in comparing different types of business intelligence tools.
Key Features & Considerations
- Verified User Reviews: Access detailed pros and cons from people in similar roles, giving you an honest look at a tool's strengths and weaknesses.
- Comparison Grids: See a side-by-side feature comparison of top contenders to easily spot key differences.
- Pricing Model: Free to browse and research. Pricing for the tools listed is provided by the individual vendors.
- Best For: Small businesses, freelancers, and agencies in the initial research phase, looking to create a shortlist of relevant monitoring tools.
Actionable Tip: Use G2’s filters to narrow the list to tools specifically rated for "Small Business." Read the most recent low-star reviews (1-3 stars) for your top candidates to understand their most common limitations or problems before committing to a trial.
Website: https://www.g2.com/categories/website-monitoring
Website Performance Monitoring Tools Comparison
| Tool | Core Features | User Experience / Quality Metrics | Value Proposition | Target Audience | Price Points / Pricing Model |
|---|---|---|---|---|---|
| Datadog | Synthetic & Real User Monitoring, APM, Logs | Code-free browser test recorder, session replay | Enterprise-grade, deep cloud integrations | Tech teams needing full-stack observability | Usage-based pricing per runs/tests |
| New Relic | Uptime, Synthetics, RUM, APM, Infrastructure | Free tier with generous data allowance | Full-stack observability with free tier | Teams standardizing on one vendor | Usage-based, free tier available |
| Dynatrace | RUM, synthetics, AIOps, app security | AI-powered root-cause diagnostics | Enterprise-grade, transparent pricing | Large teams with complex needs | Per session/request, complex pricing |
| Pingdom (SolarWinds) | Uptime checks, page speed, RUM | Simple setup, easy UI | User-friendly, marketing/web teams | Marketers & web teams | Calculator/quote-based pricing |
| Uptrends | Website/API monitoring, RUM, transaction | Intuitive recorder, global checkpoints | Granular pricing, fast deployment | Small to mid-sized business teams | Credit-based pricing |
| UptimeRobot | Uptime, keyword, port checks, status pages | Easy to set up, basic uptime monitoring | Budget-friendly, simple use | Beginners & small businesses | Low cost, free & paid plans |
| GTmetrix | Scheduled page performance testing | Visual diagnostics, filmstrips & videos | Affordable, visual performance insights | Developers & marketers tracking speed | Entry-level pricing; per-URL testing |
| SpeedCurve | RUM + synthetic tests, Core Web Vitals | Business impact focus, flexible plans | Links performance to business outcomes | Media & ecommerce performance teams | Plans from $90/month |
| WebPageTest | Lab testing with browsers, API, films | Highly detailed diagnostics | Best-in-class testing and API access | Performance engineers | Free & Pro with test quotas |
| Amazon CloudWatch | Synthetic canaries, RUM, AWS integration | Tight AWS ecosystem integration | Best for AWS users, granular pricing | AWS teams and developers | Usage-based, free tier for canaries |
| Microsoft Azure Monitor | Browser RUM, synthetic tests, telemetry | Powerful KQL analytics, customizable alerts | Best for Azure users, cost-efficient | Azure customers and enterprises | Usage-based, commitment discounts |
| G2 – Website Monitoring | Marketplace with reviews & feature grids | Aggregated user ratings and feedback | Helps compare and shortlist tools | Buyers researching monitoring software | Free to use; no direct pricing |
Your Next Step Towards a Faster, More Reliable Website
Navigating the world of website performance monitoring tools can feel overwhelming, but the journey starts with one crucial step: choosing one. As we've seen, the difference between a thriving online business and a frustrating user experience often comes down to proactive monitoring. One-time speed tests are helpful, but they only give you a snapshot. True performance mastery comes from consistent, ongoing observation.
The key takeaway is that you don't need a massive budget or a dedicated IT team to get started. The goal is to move from reacting to problems to preventing them. Instead of waiting for a customer to complain that your site is down, a tool like UptimeRobot can alert you within minutes, giving you a head start on a solution. Instead of guessing why your bounce rate is high, a tool like GTmetrix or the free tier of New Relic can reveal performance issues that are driving visitors away.
How to Choose Your First Tool
Selecting the right tool depends on your current needs, technical comfort, and budget. Don't aim for the most complex solution if you're just starting out.
- For Absolute Beginners: If you're a freelancer or small business owner who just needs to know if your site is online, start with UptimeRobot. It's incredibly simple to set up and its free tier provides immense value.
- For Growth-Focused Businesses: If you're ready to dig a little deeper into why your site is slow, GTmetrix or Pingdom offer a perfect balance of user-friendly reports and actionable insights. They help you pinpoint specific issues like large images or slow-loading scripts.
- For Technical Teams: If your website is a complex application or you have a developer on your team, exploring a more robust platform like Datadog or New Relic is a logical next step. These tools go beyond simple uptime and page speed, offering visibility into the underlying code and infrastructure.
For those with more advanced technical requirements who need to monitor the entire software stack, not just the website front-end, the world of Application Performance Monitoring (APM) offers even greater depth. To help engineers choose the ideal solution for comprehensive system health, we also offer an in-depth application performance monitoring tools comparison.
Ultimately, the best tool is the one you will actually use. Start small, get comfortable with the data, and build your monitoring strategy from there. A fast, reliable website is your most powerful asset for converting visitors into loyal customers, and consistent monitoring is the insurance policy that protects it. Combining a high-performance foundation, like a site built with the Solo AI Website Creator, with a diligent monitoring practice creates an unbeatable combination for sustainable growth.
Ready for a website that's built for performance from day one? The Solo AI Website Creator generates lightning-fast, SEO-optimized sites in seconds, giving you the perfect foundation to monitor and maintain. Start with a high-performance baseline and focus on what matters most: growing your business. Try the Solo AI Website Creator today